Have you ever looked at the night sky and wondered how scientists know so much about stars just from tiny points of light? This project is one of my favorite examples of how programming can turn giant piles of space data into something understandable. At first glance, the code may look like a lot of scientific steps and machine learning pieces stacked together, but the real idea is actually very simple: I gave a computer information about objects in space and asked it to learn how to tell what kind of object it was looking at.
It Starts with a Toolbox
Every project begins with tools. In Python, these tools are libraries that help us work with data, math, and visualization. I like to think of them as instruments in a scientific lab.
- Pandas → Organizing data like spreadsheets
- NumPy → Handling numerical calculations
- Matplotlib → Visualizing patterns in data
- Scikit-learn → Machine learning models
Light From the Universe
The dataset comes from real telescope observations. Each row represents an object in space — a star, galaxy, or quasar. Instead of normal images, we work with light measurements captured through different filters: u, g, r, i, z.
These filters are like different “color lenses” that reveal different versions of the same object.
Cleaning the Universe First
Raw space data is never perfect. Some values are missing, and some are completely invalid. Before analysis, we clean the dataset by removing noise and replacing incorrect values.
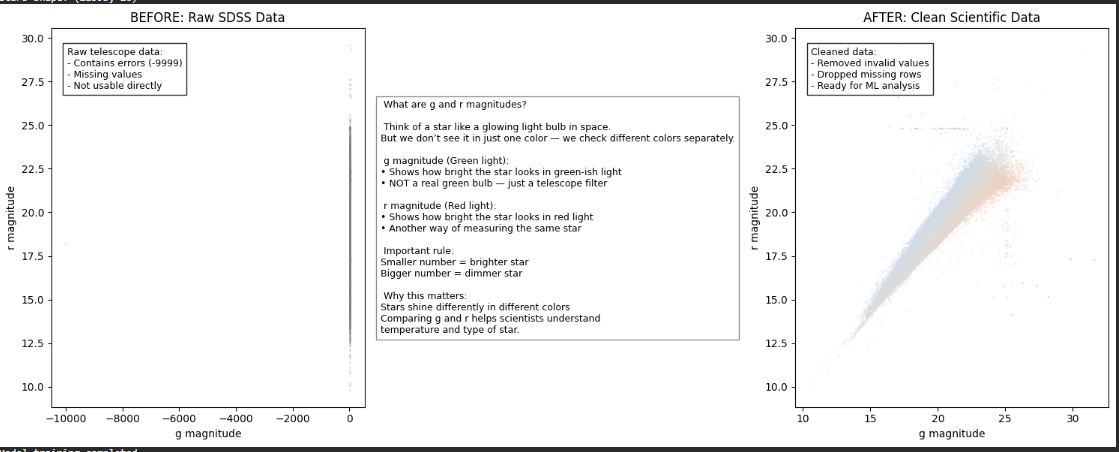
This step is important because machine learning models can only learn correctly from clean data.
Teaching the Computer
Now comes the machine learning part. We use a Random Forest model, which is basically a group of decision trees that vote together to decide the final answer.
The model learns from five features (u, g, r, i, z) and predicts whether the object is a star, galaxy, or quasar.
What Stars Look Like in the Universe
When we plot real telescope data, each dot represents one star in the universe. Together, they form a pattern that tells us how stars behave.
We use two main measurements: brightness (g magnitude) and color index (g - r).
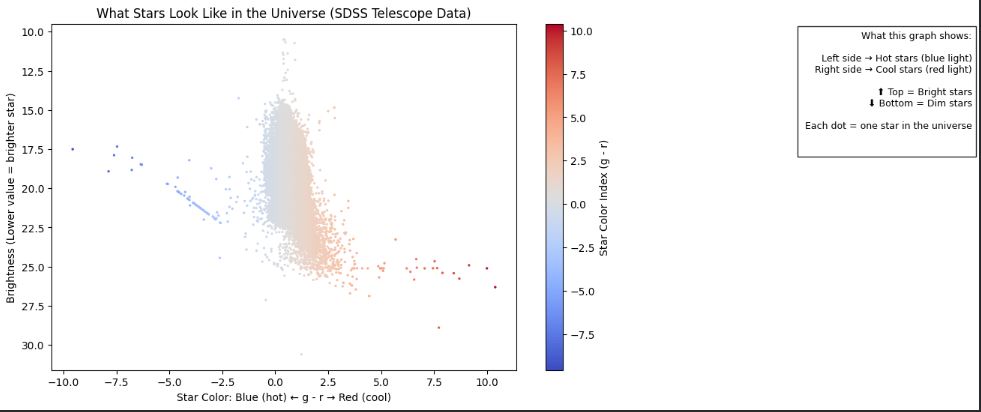
This graph shows something interesting — stars are not random. They naturally group into patterns based on temperature and brightness.
NASA-Style Classification of Light
Telescopes don’t “see” objects directly — they measure light. Each filter contributes differently to how we classify objects.
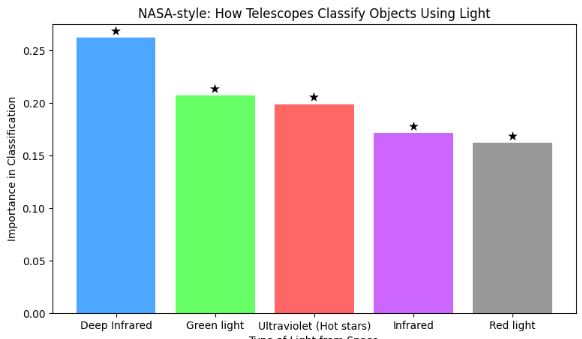
This shows which type of light matters most when the model decides what an object is.
Stage of Star Life
Stars are not fixed objects — they evolve over time. Using brightness and color data, we can actually visualize where a star is in its life cycle.
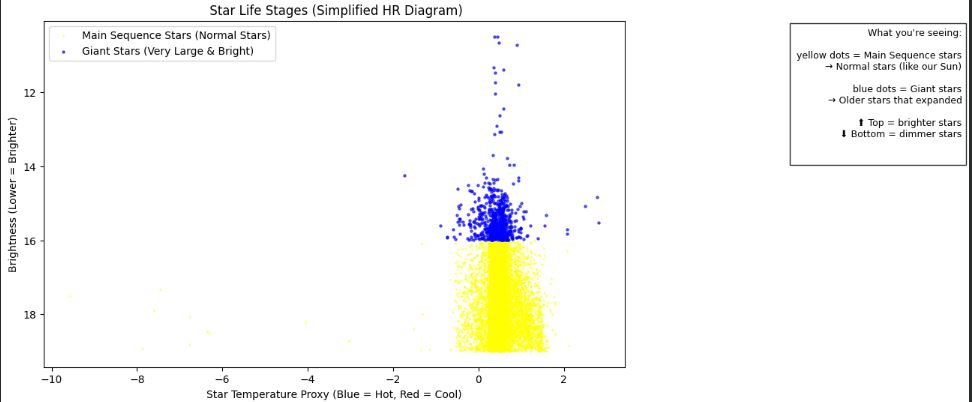
What Kind of Star Is This?
When we group stars using temperature and brightness, natural clusters appear in the data. Each cluster tells us something about the star’s energy and age.
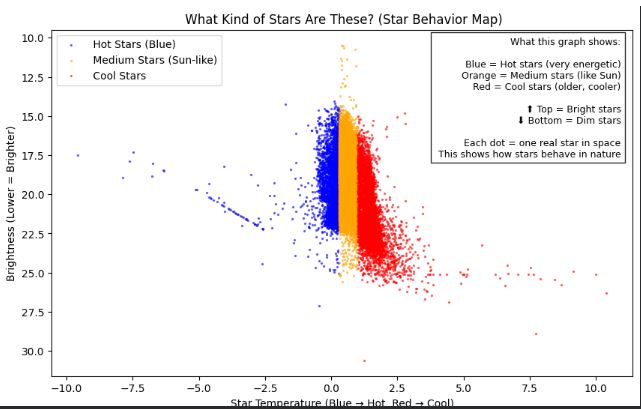
This is not random — it is a “behavior map” of stars based on how they emit light across different wavelengths.
Final Thought
What I like most about this project is how it quietly connects two worlds that don’t usually meet — space and computation. A few lines of code are enough to take faint light signals from distant stars and turn them into something meaningful. And that changes how you look at the night sky — it’s no longer just something to observe, but something you can actually make sense of.